
In computer science, the phrase “garbage in, garbage out” is commonly used to describe the concept that input quality determines output quality. This concept also applies to pharmaceutical tableting processes. An unsuitable tablet formulation or process will result in problems during tableting and produce tablets that don’t meet the required quality standards. But how do you assess your formulation before entering full-scale manufacture? How can you be sure that your powder’s material properties will give you the desired result? In other words, how can you avoid putting garbage in?
The powder properties that have the greatest impact on tablet manufacture and quality are those relating to compaction and lubrication. Of course, adequate flow and the uniform distribution of the active pharmaceutical ingredient (API) within the powder are also required, but these are generally easier to achieve. In this article, we’ll delve into how to assess a powder’s compaction and lubrication properties in order to make better tablets.
The major issue holding back proper understanding of powder tableting has been the difficulty of studying compaction and lubrication behavior on a laboratory scale under controlled conditions. The key requirement for a “fair test” with which to assess powder properties has been missing. To address this issue, USP <1062>included the compaction triangle, as shown in Figure 1.
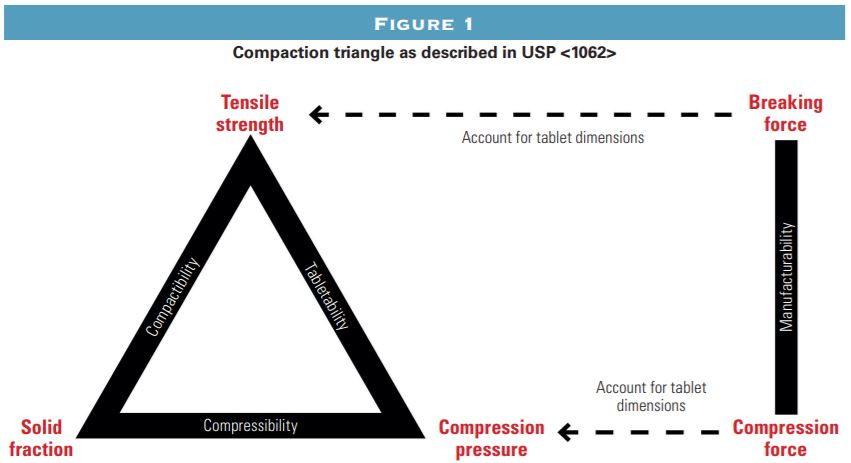
The compaction triangle describes three relationships that can be used to evaluate a material’s compaction properties: tabletability, compressibility, and compactability. Compaction triangle data characterizes a material’s intrinsic compaction behavior. For this reason, the calculations involved always take into account the tablet size and shape, so the tablet dimensions used to generate the data need not match those of the tablets being manufactured in full-scale production. The compaction triangle characterizes compaction behavior, but USP <1062>does not cover how to evaluate blend lubrication. This can be achieved by measuring the forces required to remove the tablet from the die after compaction—the ejection and detachment forces. This data can forewarn the user if their formulation has a propensity for sticking and picking.
Compaction analysis data facilitates a Quality-by-Design (QbD) approach to formulation development. By studying lubrication and compaction behavior in this way, it is possible to see the effect of formulation and process changes on tablet properties. This includes understanding the impact of parameters such as blending time, moisture content, or lubricant concentration. These will be very familiar to formulation developers, as understanding their impact is essential to implementing QbD in the development process.
Assessing the compaction and lubrication properties of tablets in the laboratory has recently become possible using advanced powder compaction analysis instruments. Using state-of-the-art measurement and data-handling techniques, these instruments assess compaction and lubrication behavior through the measurement of tablet compaction, ejection, and detachment forces under controlled conditions. Previously, these measurements have required expensive and complex compaction simulators.
These simple laboratory systems can accurately evaluate a large number of formulation and process options in a short time. Sample testing for a single formulation can be completed in as little as 15 minutes with less than 2 grams of material, and available software automatically carries out calculations and generates easy-to-interpret plots. The software displays the sample results with comparison to industry standard critical quality attributes. Data generated includes the USP <1062>characteristics (tabletability, compressibility, and compactibility), lubrication behavior, and tablet elastic recovery.
The following paragraphs describe the data summarized by the compaction triangle, how it is generated, and what the results mean for a formulation. The same information and discussion are also provided for lubrication measurements and tablet elastic recovery. A set of example data for three formulations is provided for illustrative purposes. The data was generated using a Gamlen compaction analyzer. Fifteen tablets were manufactured from each formulation using five different compaction pressures (three tablets at each pressure). The tablets were then weighed, and their dimensions measured before their breaking strength was measured using a Gamlen Tablet Tensile Analyser.
Tabletability
As set out in USP <1062>, a tabletability profile describes how tablet tensile fracture strength (TFS) changes with compaction pressure. Tablet tensile fracture stress is calculated from the tablet breaking strength, often referred to as tablet hardness, accounting for the dimensions of the tablet.

TFS is often the most discriminating and useful piece of data generated by compaction analysis. The higher the TFS, the better the product is able to withstand handling and processing. The recommended minimum TFS is 2 megapascals at compaction pressure of 200 megapascals.
The example tabletability profile in Figure 2a shows significant differences in tablet strength between the three formulations, with F2>F1>F3. The F3 tablets are the weakest by far, with tablet tensile fracture stress values falling in the “poor” region of the plot. If selected for use, this formulation can be expected to generate major production issues associated with low tablet hardness. The data for the other two formulations fall within the borderline region and do not achieve the recommended strength values. These formulations can also be expected to lead to compaction problems, including high friability and erosion during film coating.
Compressibility
A compressibility profile shows how the solid fraction of the tablets changes with increasing compaction pressure. The solid fraction of a tablet is the inverse of its porosity. A tablet with a high solid fraction will have a low porosity. For example, a tablet with a solid fraction of 0.9 has a porosity of 0.1. Solid fraction is calculated as:
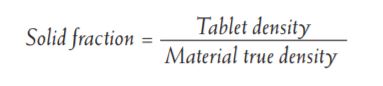
A tablet’s maximum recommended solid fraction depends on the properties of its principal component. For most materials, a maximum solid fraction of 0.95 is recommended, but some materials (notably calcium salts) require higher values to achieve acceptable tablet properties.
High solid fraction values are linked to capping issues in production and can also result in long dissolution times, as the low porosity prevents liquid from penetrating into the tablet. In the example compressibility profile shown in Figure 2b, the solid fraction values for all formulations across all compaction pressures are between 80 and 95 percent.  However, as the compaction force increases, Formulation 3 shows very little change in density. This is a warning sign of possible problems. A good formulation shows a progressive increase in density with increasing compaction pressure. Formulations that have plateaued at a particular density are prone to capping, as the limits of the material have been reached. This often coincides with no further increase in TFS with increasing compaction pressure, another warning sign of problems.
A note on material true density values: The material true density value of the sample is the one piece of information needed prior to analysis to generate a full compaction triangle data set. For most excipients and well-studied APIs, this value can be easily found in a suitable reference. It is an additive value, so the true density of a blend can be calculated from the true density values of its individual components. In a case where the material true density value is simply not available, compaction analysis can still provide useful information because the tabletability profile (often the most useful piece of data) is independent of the material true density value. A lubrication assessment can also be carried out without the true density value.
Compactibility
A compactibility plot shows how the tablet tensile fracture stress changes with solid fraction. Generally, tablet tensile strength increases exponentially with solid fraction, as the presence of fewer or smaller pores strengthens a compact. If two samples display similar solid fractions but differing tablet tensile strength values, then the difference in strength is caused by differences in the binding forces in the tablet. Very high densities due to over compaction result in slower dissolution and increased risk of capping.
In the example compactibility profile in Figure 2c, the data show that tablets of similar solid fraction from each formulation have significantly different strengths. This implies that the differences in tablet strength between the formulations are not due to differing levels of porosity but rather to something more fundamental about the particle interactions in the tablet. These differences are most likely the result of a change in excipient concentration or a major change in the manufacturing process, such as changing from granulation to direct compression, which usually reduces product performance.
Elastic recovery
For most formulations, the tablet dimensions change after the lower punch ejects the tablet from the die. Occasionally, the tablet contracts, but typically it expands. This dimensional change is termed elastic recovery. 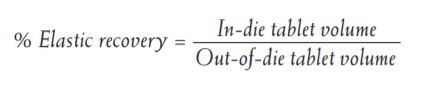 Elastic recovery is measured as the percentage difference between the tablet volume at the time of ejection (the in-die tablet volume) and the tablet volume after ejection (the out-of-die tablet volume). High elastic recovery values have been linked to capping problems in production, but the relationship is complex, and the measurement is not a definitive indicator of capping. If capping is a problem with a formulation, looking at the elastic recovery and the solid fraction values (compressibility profile) is recommended. For all tablets in the example data set, the elastic recovery values are acceptably low (less than 3 percent).
Lubrication data
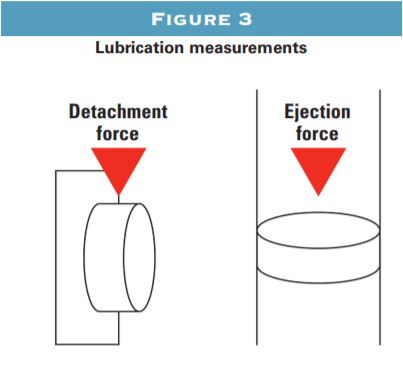
A full lubrication evaluation requires two measurements, as shown in Figure 3. Ejection force is the force required to push the tablet out of the die. Take-off force, or detachment force, is the force needed to detach the ejected tablet from the lower punch tip. Both measurements are used to evaluate the formulation’s lubrication status. Higher forces indicate poor lubrication and an increased risk of sticking and picking. Force values are converted to stress data to account for tablet dimensions. Maximum ejection and detachment stresses of 3 megapascals are generally recommended, but maximum acceptable stresses as low as 1 megapascal can be recommended for products that are particularly prone to sticking.

As shown in Figure 4, the detachment and ejection stress values for all example tablets were acceptably low, indicating that all three blends were well lubricated. The lubrication stresses were largely independent of compaction pressure, which is typical for well-lubricated formulations. Although the ejection stresses for Formula 1 were somewhat higher than the other variants, they were well within the acceptable range. No lubrication problems would be anticipated for these formulations.
Having assessed the results of the evaluation, we can draw the following conclusions:
• The rank order of the formulations’ compactibility is F2>F1>F3.
• None of the formulations reach the critical tabletability threshold. Even F2 would benefit from improved tabletability.
• All formulations are well lubricated.
Based on these observations, and assuming that the processing properties of all the products were acceptable, then Formulation 2 would be selected for further work. To improve the formulation’s tabletability, developers could consider adding a compression aid such as microcrystalline cellulose, changing an excipient in the formulation to a more compressible grade, or adjusting the lubrication (by reducing the lubricant concentration or blending time). The developers could then quickly see the impact of such changes by repeating the analysis, allowing for rapid formulation development with minimal outlays of time and materials.
Michael J. Gamlen is chief scientific officer and Rebecca U. McVicker is product director at Gamlen Tableting (+44 0 115 912 4271, www.gamlentableting.com). The company manufactures a range of advanced powder compaction analyzers, which can be combined with its Gamlen Dashboard software to create the first fully automated compaction analysis system.